 3:27
3:27Plays here · Open on youtube ↗
UnknownPublic YouTube title and description directly attribute the demonstrated workflow to Lucidchart or Lucidspark; no platform disclosure, explicit sponsorship statement, creator-specific commercial URL, or verified Lucid program membership was captured. https://www.youtube.com/watch?v=5WjXB5o6Vc03:27 · spoken hook
“All right, let's take a look at how we can use Lucid chart”
The opening line · 0:00 · move: howto
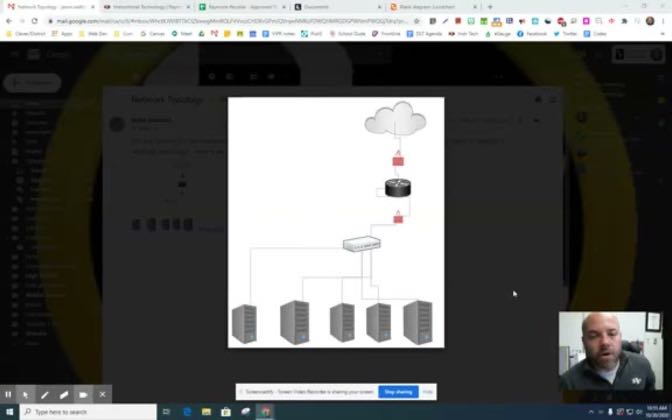
Shows teachers how to turn a network graphic-organizer assignment into a connected Lucidchart diagram and export it for submission through Canvas.
17views—likes↑0.3×vs their usual post · 64 views—creators ran this script
@Instructional Technology · 82 followers · creator page →
The script75 lines · @Instructional Technology
- 0:00All right, let's take a look at how we can use Lucid chart
- 0:04to accomplish similar structures as this
- 0:07for a graphic organizer, very similar to like packet tracer.
72 more linesmembers read and copy every script on the site
@Instructional Technologyyoutube · 82 followers · median 64 views · n=60best post170.3×views · for Lucidchart / LucidsparkUnknown Public YouTube title and description directly attribute the demonstrated workflow to Lucidchart or Lucidspark; no platform disclosure, explicit sponsorship statement, creator-specific commercial URL, or verified Lucid program membership was captured. https://www.youtube.com/watch?v=5WjXB5o6Vc0Open creator →Views and likes are public counts at capture time. The multiple compares this post with the creator’s own recent median, not a claim about what caused its reach. Read the methodology →