Loading the library…
 PAID0:40
The anchor — the post this playbook is read from.
Open the post page →
Playbook
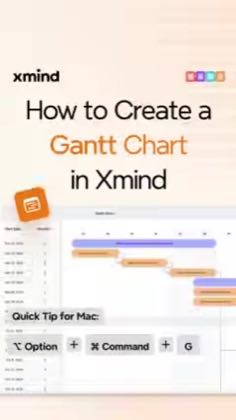
Switch the map to Gantt, then reveal the schedule
Switch a project mind map into Gantt view, then show its tasks as scheduled bars with dates or dependencies.
Who runs it Xmind official YouTube channel
7.4Kviews tracked · 3 posts1creators ran it4.5Kbest post
3 of 3 posts say unknown
Not dissected yet. The captured frames and transcript are the available evidence.
The script7 lines · 0:40 · @Xmind for XMind
- 0:00Here's how to do it.
- 0:02Start by opening X-Mind and using AI Work Breakdown to generate your project plan.
- 0:08Once your tasks are in place, head to the toolbar and click "Gount".
4 more linesmembers read and copy every script on the site
These moves recur in the brand’s own channel. They show its publishing strategy; they do not establish repetition across independent creators.
- Switch the project map to Gantt through a visible control
Read the source quotes
head to the toolbar and click "Gount".
Open the source post →And then, I can switch straight to GAM chart.
Open the source post →With just one click, switch from Mindmap to Gantt Chart.
Open the source post → - Reveal and explain the scheduled task bars
Read the source quotes
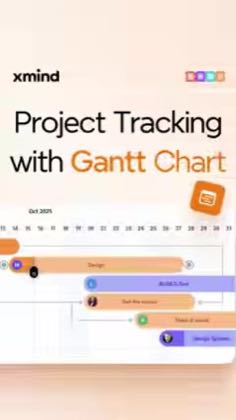
On the right, each task shows up as a horizontal bar.
Open the source post →Timeline, dependencies, workflow, everything becomes so clear.
Open the source post →And see all your tasks, timelines and dependencies laid out clearly, visually.
Open the source post →
What varies: The step-by-step tutorial names toolbar and menu controls; the phone-shot testimonial generates AI tasks first and adds a historical Black Friday offer; the short launch clip contrasts an existing map with its timeline and ends with a longer-tutorial prompt.
Scope: The shared script begins at the map-to-Gantt switch. AI work breakdown is present in only two episodes and is not claimed as universal. These are product workflow demonstrations, not proof of reduced project delays, sales or a paid presenter contract.
This playbook belongs to a structure shared across brands. Its member videos count toward each structure’s total. Open a structure to compare the grouped playbooks.